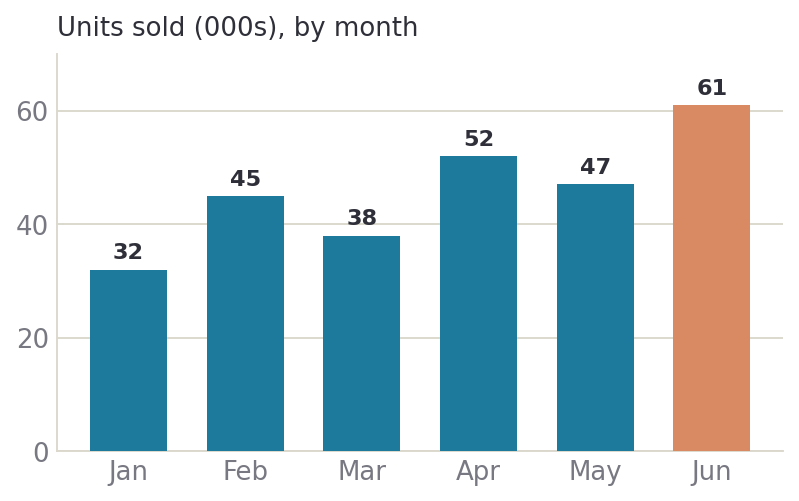
Read the geometry
Colors, Relative heights, position, trends.
Information from bars alone. Interprets relative magnitude, ordering, and visual differences among categories.
isolates whether the model sees the chart, before it reads it.
Diagnostic Study · vision-language models
Georgetown University · GUCV Lab
When a model gets a chart question wrong, which skill failed? ChartProbe decomposes one hard question into simple, skill-targeted probes with exact, computed answers, so a failure points at a cause.
Overview
Teach a vision-language model to read a chart, not to reason over it, and much of its complex reasoning comes back for free.
The idea
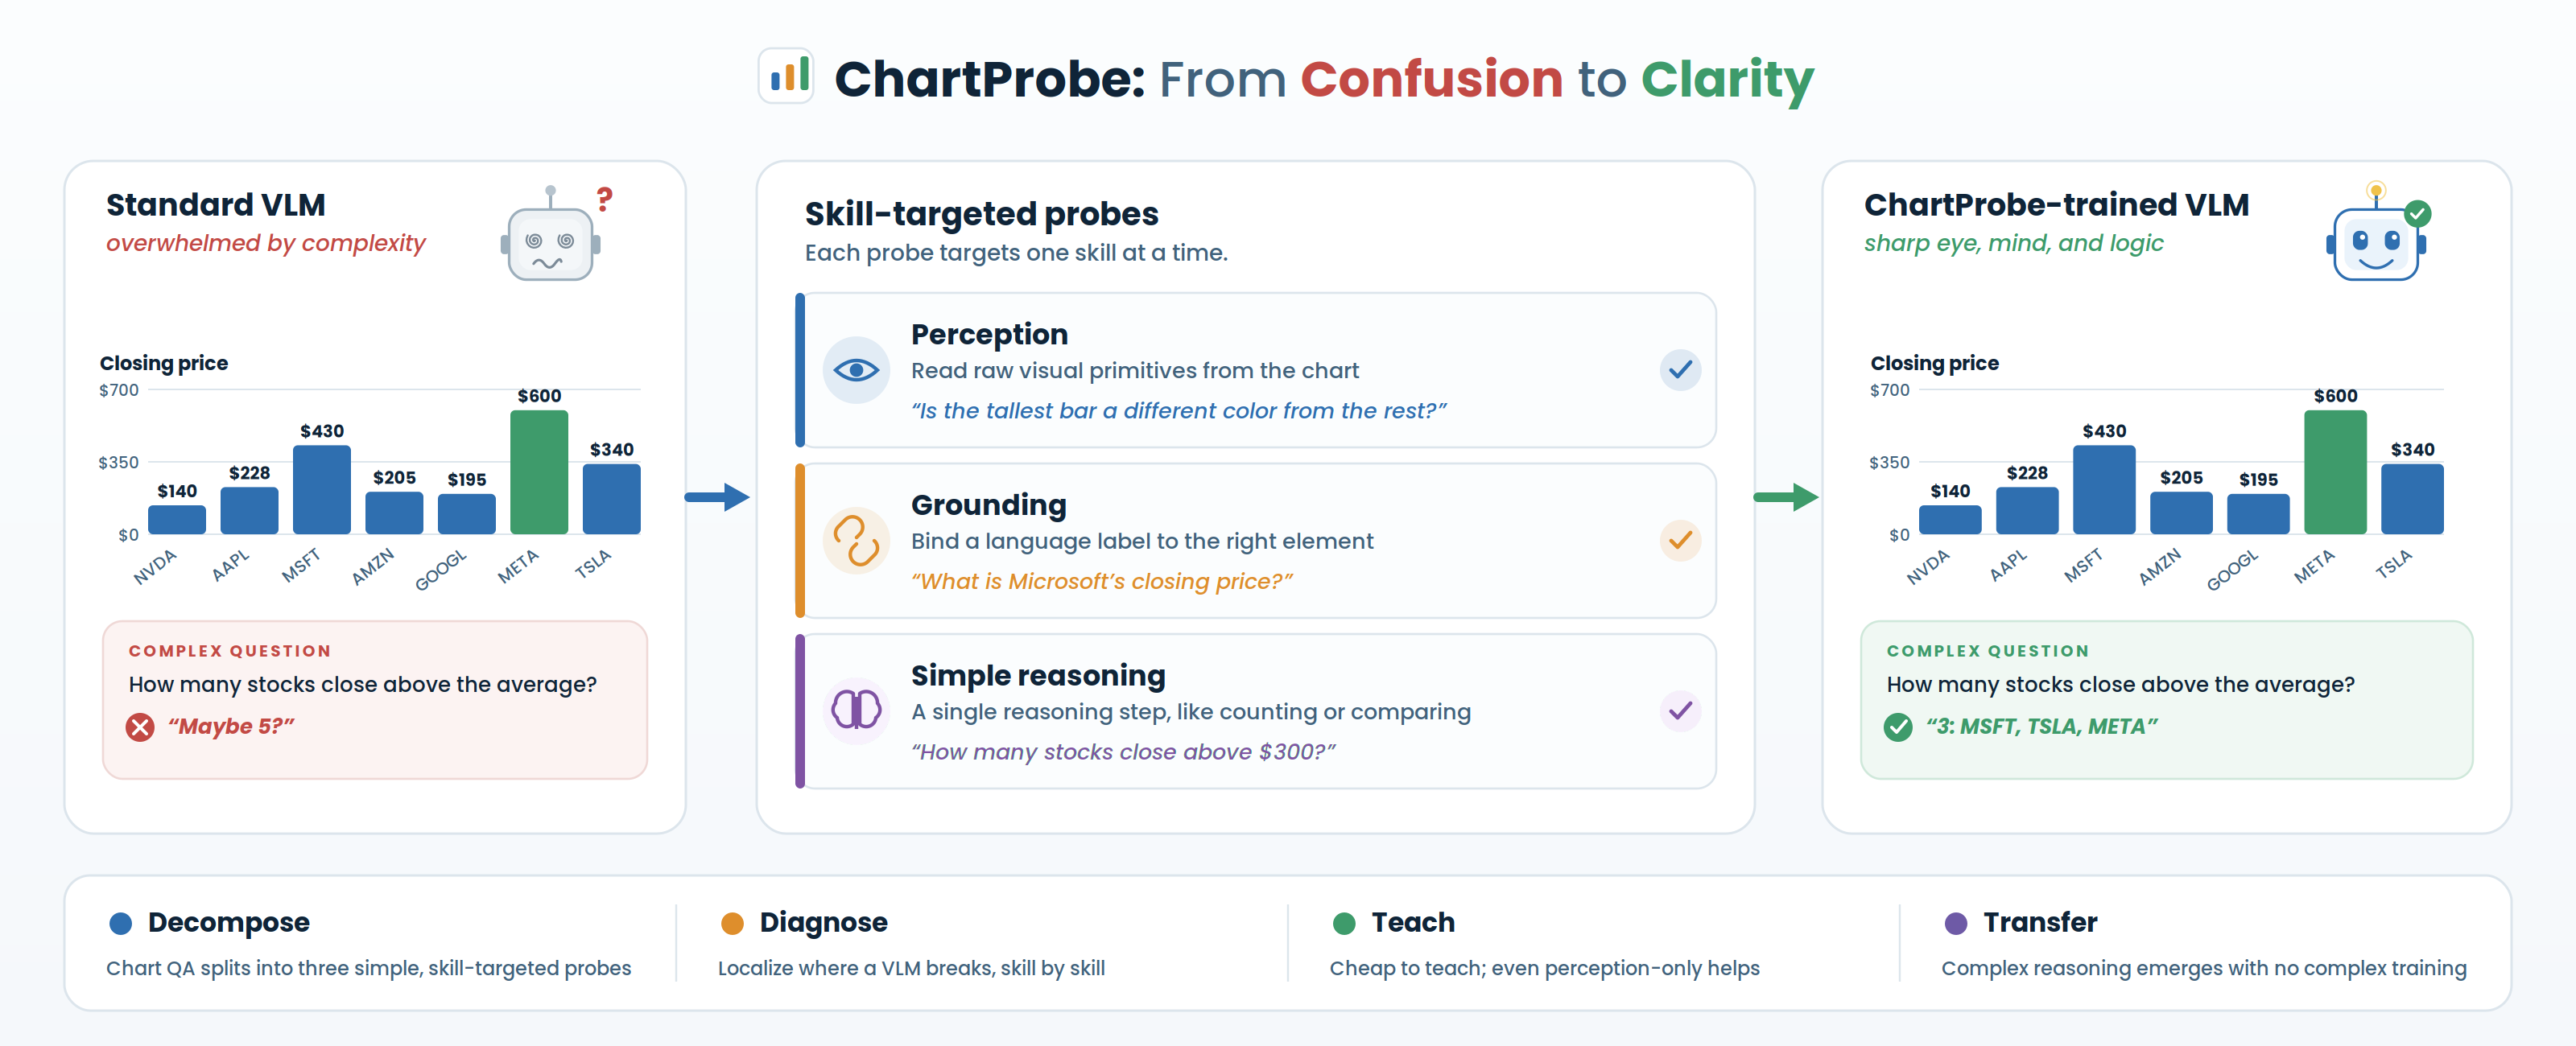
A chart answer can break for very different reasons. ChartProbe asks nine probes per chart, three targeting each skill, each written so a wrong answer attributes cleanly to a single cause.
Colors, Relative heights, position, trends.
Information from bars alone. Interprets relative magnitude, ordering, and visual differences among categories.
isolates whether the model sees the chart, before it reads it.
Label to bar, value, and box.
Tie a named reference to one visual element: recover its category, read its value, or localize its box.
isolates language-to-element correspondence, scored by IoU.
Rank, sum, mean, difference.
A single computation over the values the other skills recover. One step, not a chain.
isolates the arithmetic step on its own.
Three lenses. Each probe targets one atomic skill.
Headline finding
Fine-tuning on the simple skills alone, with no reasoning examples, lifts held-out complex multi-hop reasoning the model was never trained on.
The transfer holds across three open-weight VLMs, and the gains carry over to three out-of-distribution settings, including ChartQA, which is human-authored and disjoint from our charts and templates.
Evidence
Held-out complex-reasoning accuracy (fuzzy %) on CR-500, 500 questions per domain, across three open-weight models. No configuration is trained on any complex-reasoning question; fine-tuned rows are the mean over three seeds, with absolute change over the base model shown.
| InternVL-3.5-8B | Qwen3.5-9B | LLaVA-1.6 Mistral-7B | |||||||
|---|---|---|---|---|---|---|---|---|---|
| Train | Bar | Pie | CLEVR | Bar | Pie | CLEVR | Bar | Pie | CLEVR |
| Base | 24.0 | 26.0 | 48.0 | 8.6 | 9.0 | 20.2 | 17.3 | 18.5 | 7.0 |
| P | 36.7+12.7 | 40.9+14.9 | 64.5+16.5 | 17.6+9.0 | 25.8+16.8 | 42.6+22.4 | 22.2+4.9 | 20.4+1.9 | 23.6+16.6 |
| G | 36.5+12.5 | 39.4+13.4 | 67.1+19.1 | 13.3+4.7 | 18.1+9.1 | 32.3+12.1 | 19.4+2.1 | 17.4−1.1 | 31.1+24.1 |
| SR | 36.6+12.6 | 39.5+13.5 | 64.5+16.5 | 23.2+14.6 | 28.8+19.8 | 42.3+22.1 | 25.9+8.6 | 20.4+1.9 | 30.0+23.0 |
| P+G | 28.5+4.5 | 34.6+8.6 | 62.4+14.4 | 28.1+19.5 | 36.6+27.6 | 57.2+37.0 | 18.9+1.6 | 17.4−1.1 | 23.4+16.4 |
| P+G+SR | 35.6+11.6 | 40.6+14.6 | 62.6+14.6 | 24.7+16.1 | 32.3+23.3 | 45.7+25.5 | 26.2+8.9 | 24.2+5.7 | 23.0+16.0 |
Single-skill P, G, SR and combined P+G, P+G+SR, all LoRA. Best per column in bold. The perception-only row is highlighted.
Construction
Each chart is born from code. The same table that draws the image also binds the template slots, so ground truth is exact by construction.
Executable code emits a chart's values as a table.
Slots bind to the table's labels, values, and extrema.
The table renders to an image; the probe carries its answer.
The rendered chart and the question are the two inputs.
Because ground truth comes from the generating code, it needs no human or model annotation, and the answer key cannot drift from the image.
Coverage
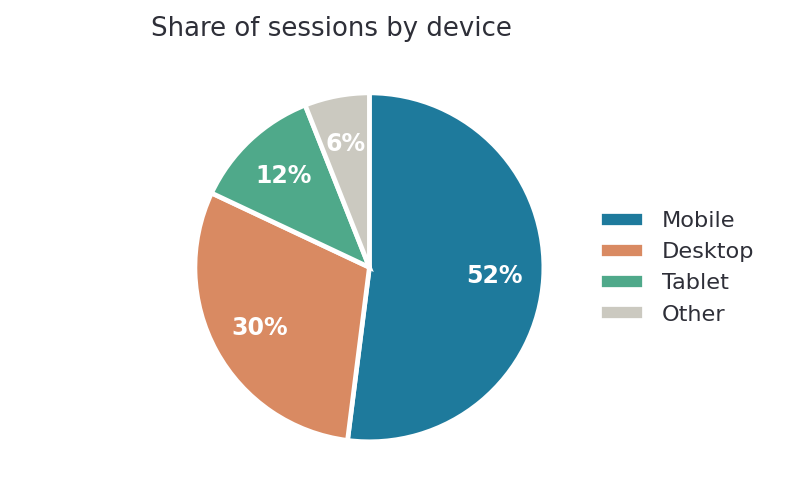
Bar and pie charts share a probe design; CLEVR reuses the three-skill idea over scene-graph primitives instead of a data table.
The same probes, re-resolved to segment geometry. An unseen chart type at test time.
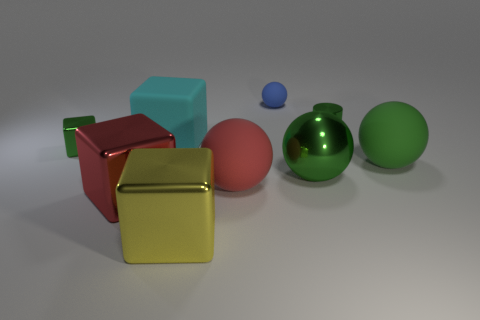
Objects, colors, materials, and spatial relations. An unseen visual domain, ground truth from the scene graph.